
As evidenced by this diagram, which I recently encountered. I had my suspicions, but I didn't think it'd be graphable.

Original text under picture:
Original text under picture:
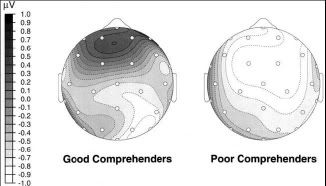
Fig. 2. Voltage maps of mean amplitude of the joke effect (jokes minus non-jokes) measured 300–500 ms in 14 good (left) and 14 poor (right) joke comprehenders.

 At least it really reminds me why the best of the best jokes are always the most classic and the most appriecated here at BuF forums. If we get the joke, then there's